


In this section, the 104 finally selected articles have been considered. The data were synthesized to address the five research questions mentioned.
General questions (GQ)
GQ1: Which were the most relevant authors, articles, sources, countries, and trends in the literature review on financial fraud detection based on the application of machine learning (ML) models?
Authors
The literature on financial fraud detection applying ML models has been studied by a large number of authors. However, some authors stood out in terms of the number of published papers and number of citations. Specifically, the most significant authors with two publications are Ahmed M. (with 318 citations), Ileberi E. (82 citations), Ali A. (20 citations), Chen S. (84 citations), and Domashova J and Kripak E. (each with 6 citations). Other relevant authors with one publication and who have been cited several times are Abdallah A. (with 333 citations), Abbasimehr H. (18 citations), Abd Razak S. (13 citations), Achakzai M. A. K. (5 citations), and Abosaq H. (2 citations). The aforementioned authors have contributed significantly to the development of research in financial fraud detection using ML models (Fig. 2).

Shows the analysis of the connections between authors based on co-authorship of publications. Produced with VOSviewer.
Collectively, the researchers have contributed a solid knowledge base and have laid the foundation for future research in financial fraud detection using ML models. Although other researchers contributed to the field, such as Khan, S. and Mishra, B., both with 7 citations, among others, some have been more prominent in terms of the number of papers published. Their collective works have enriched the field and have promoted a greater understanding of the challenges and opportunities in this area.
Articles
As depicted in Fig. 3, clusters 2 (green) and 4 (yellow) present the most relevant research articles on financial fraud detection using ML models. Cluster 2, comprising 9 articles with 357 citations and 32 links, is highlighted because of the significant impact of the articles by Sahin, Huang, and Kim. These articles have the highest number of citations and are deemed to be useful starting points for those intending to dive into this research field. Cluster 4, constituting 6 articles with 158 citations and 27 links, includes the works of Dutta and Kim, who have also been cited considerably.

Depicts the connections between articles based on their bibliographic references. Produced with VOSviewer.
Articles in clusters 1 (red) and 3 (dark blue) could be valuable sources of information; however, they were observed to have a lower number of citations and links than those in clusters 2 and 4, such as that of Nian K. (62 citations and 4 links) and Olszewski (92 citations and 4 links). However, some articles in these clusters have had a substantial number of citations.
In Cluster 10 (pink), the article by Reurink A. is prominent, with 38 citations. This is followed by the article by Ashtiani M.N. with 10 citations. In Cluster 11 (light green), the article by Hájek P. has 129 citations. In Cluster 12 (grayish blue), the articles by Blaszczynski J. and Elshaar S. have the greatest number of citations, indicating their influence in the field of financial fraud detection.
In Cluster 13 (light brown), the article by Pourhabibi T. has the greatest number of citations at 102, suggesting that he has been relevant in the research on financial fraud detection. Finally, in Cluster 14 (purple), the articles by Seera M. have 63 citations and 2 links. The article by Ileberi E. has 11 citations and 1 link. Both articles have a small number of citations, indicating a lower influence on the topic.
In conclusion, clusters 2, 4, and 11 are the most relevant in this literature review. The articles by Sahin, Huang, Kim, Dutta, and Pumsirirat are the most influential ones in the research on financial fraud detection through the application of ML models.
Sources
The information presented in Fig. 4 is the result of a clustering analysis of the articles resulting from the literature review on financial fraud detection by implementing ML models. In total, 48 items were identified and grouped into 12 clusters. The links between the items were 100, with a total link strength of 123.

Shows the relationship between different scientific journals based on bibliographic links. Produced with VOSviewer.
The following is a description of each cluster with its respective number of items, links, and total link strength (the number of times a link appears between two items and its strength):
Cluster 1 (6 articles—red): This cluster includes journals such as Computers and Security, Journal of Network and Computer Applications, and Journal of Advances in Information Technology. The total number of links is 27, and the total link strength is 32.
Cluster 2 (6 articles—dark green): This cluster includes articles from Technological Forecasting and Social Change, Journal of Open Innovation: Technology, Market, and Complexity, and Global Business Review. The total number of links is 18, and the total link strength is 19.
Cluster 3 (5 articles—dark blue): This cluster includes articles from the International Journal of Advanced Computer Science and Applications, Decision Support Systems, and Sustainability. The total number of links is 19, and the total link strength is 20.
Cluster 4 (4 articles—dark yellow): This cluster includes articles from Expert Systems with Applications and Applied Artificial Intelligence. The total number of links is 26, and the total link strength is 45.
Cluster 5 (4 articles—purple): This cluster includes articles from Future Generation Computer Systems and the International Journal of Accounting Information Systems. The total number of links is 15, and the total link strength is 16.
Cluster 6 (4 articles—dark blue): This cluster includes articles from IEEE Access and Applied Intelligence. The total number of links is 18, and the total link strength is 26.
Cluster 7 (4 articles—orange): This cluster includes articles from Knowledge-Based Systems and Mathematics. The total number of links is 23, and the total link strength is 29.
Cluster 8 (4 articles—brown): This cluster includes articles from the Journal of King Saud University—Computer and Information Sciences and the Journal of Finance and Data Science. The total number of links is 13, and the total link strength is 13.
Cluster 9 (4 articles—light purple): This cluster includes articles from the International Journal of Digital Accounting Research and Information Processing and Management. The total number of links is 2, and the total link strength is 2.
The clusters represent groups of related articles published in different academic journals. Each cluster has a specific number of articles, links, and total link strength. These findings provide an overview of the distribution and connectedness of articles in the literature on financial fraud detection using ML models. Further, clustering helps identify patterns and common thematic areas in the research, which may be useful for future researchers seeking to explore this field.
Clusters 1, 4, and 7 indicate a greater number of stronger articles and links. These clusters encompass articles from Computers and Security, Expert Systems with Applications, and Knowledge-Based Systems, which are important sources for the SLR on financial fraud detection through the implementation of ML models.
Countries
The analysis presented indicates the number of documents related to research in different countries and territories. In this case, a list of 50 countries/territories and the number of documents related to the research conducted in each of them is presented. China leads with the highest paper count at 18, followed by India at 13 and Saudi Arabia and Canada at 9 each. Canada, Malaysia, Pakistan, South Africa, the United Kingdom, France, Germany, and Russia have similar research outputs with 4–9 papers. Sweden and Romania have 1 or 2 research papers, indicating limited scientific research output.
The presence of little-known countries such as Armenia, Costa Rica, and Slovenia suggests ongoing research in places less common in the academic world. From that point on, the number of papers has gradually decreased.
The production of papers is geographically distributed across countries from different continents and regions. However, more research exists on the subject from countries with developed and transition economies, which allows for a greater capacity to conduct research and produce papers.
Figure 5, sourced from Scopus’s “Analyze search results” option, depicts countries with their respective number of published papers on the topic of financial fraud detection through ML models.

Represents the number of scientific publications in the study area classified by country. Produced with VOSviewer.
The above shows the diversity of countries involved in the research, where China leads the number of studies with 18 papers, followed by India with 13 and Saudi Arabia and Canada each with 9 papers. The other countries show little production, with less than 7 publications, which indicates an emerging topic of interest for the survival of companies that must prevent and detect different financial frauds using ML techniques.
Trends
The most relevant keywords in the review of literature on financial fraud detection implementing ML models include the following:
In Cluster 1, the most relevant keywords are “decision trees” (13 repetitions), “support vector machine (SVM)” (11 repetitions), “machine-learning” (10 repetitions), and “credit card fraud detection” (9 repetitions). A special focus has been placed on the topic of artificial intelligence (ML), in addition to algorithms and/or supervised learning models such as decision trees, support vector machines, and credit card fraud detection.
In Cluster 2, the most relevant keywords are “crime” (46 repetitions), “fraud detection” (43 repetitions), and “learning systems” (13 repetitions). These terms reflect a broader focus on financial fraud detection, where the aspects of crime in general, fraud detection, and learning systems used for this purpose have been addressed.
In Cluster 3, the most relevant keywords are “Finance” (19 repetitions), “Data Mining” (18 repetitions), and “Financial Fraud” (12 repetitions). These keywords indicate a focus on the financial industry, where data mining is used to reveal patterns and trends related to financial fraud.
In Cluster 4, the most relevant keywords are “Machine Learning” (45 repetitions), “Anomaly Detection” (16 repetitions), and “Deep Learning” (11 repetitions). They reflect an emphasis on the use of traditional ML and deep learning techniques for anomaly detection and financial fraud detection.
In general, the different clusters indicate the most relevant keywords in the SLR on financial fraud detection through ML models. Each cluster presents a specific set of keywords reflecting the most relevant trends and approaches in this field of research (Fig. 6).

Shows the relationships between keywords based on their co-occurrence in the literature reviewed. Produced with VOSviewer.
GQ2: What types of financial fraud have been identified in ML studies?
Financial fraud is generated by weaknesses in companies’ control mechanisms, which are analyzed based on the variables that allow them to materialize. These include opportunity, motivation, self-fulfillment, capacity, and pressure. Some of these are comprehensively analyzed by Donald Cressey through the fraud theory approach. The lack of modern controls has led organizations to use ML in response to this major problem. According to the findings of the Global Economic Crime and Fraud Survey 2022–2023, which gathered insights from 1,028 respondents across 36 countries worldwide, instances of fraud within these companies have caused a financial loss of approximately 10 million dollars (PricewaterhouseCoopers, 2022).
Referring to the concept of fraud, as outlined in international studies (Estupiñán Gaitán, 2015; Márquez Arcila, 2019; Montes Salazar, 2019) and the guidelines of the American Institute of Certified Public Accountants, it is an illegal, intentional act in which there is a victim (someone who loses a financial resource) and a victimizer (someone who obtains a financial resource from the victim). Thus, the proposed classification includes corporate fraud and/or fraud in organizations, considering that the purpose is to misappropriate the capital resources of an entity or individual: cash, bank accounts, loans, bonds, stocks, real estate, and precious metals, among others.
In this SLR study, we have considered fraud classifications by authors of 86 articles, which encompass experiments. We have excluded the 18 SLR articles from our analysis. The types presented in Table 7 follow the holistic view of the authors of the research for a better understanding of the subject of financial fraud, considering whether it is internal or external fraud.
Table 7 highlights the diverse types of frauds, and the research works on them. According to the classification, external frauds correspond to those performed by stakeholders outside the company. This study’s findings show that 54% of the analyzed articles investigate external fraud, among which the most important studies are on credit card loan fraud, followed by insurance fraud, using supervised and unsupervised ML techniques for their detection.
In research works (Kumar et al., 2022) analyzing credit card fraud, attention is drawn to the importance of prevention through the behavioral analysis of customers who acquire a bank loan and identifying applicants for bad loans through ML models. The datasets used in these fraud studies have covered transactions performed by credit card holders (Alarfaj et al., 2022; Baker et al., 2022; Hamza et al., 2023; Madhurya et al., 2022; Ounacer et al., 2018; Sahin et al., 2013), while other research works have covered master credit card money transactions in different countries (Wu et al., 2023) and fraudulent transactions gathered from 2014 to 2016 by the international auditing firm Mazars (Smith and Valverde, 2021).
The second major type of external fraud is insurance fraud, which is classified as fraud in health insurance programs involving practices such as document forgery, fraudulent billing, and false medical prescriptions (Sathya and Balakumar, 2022; Van Capelleveen et al., 2016) and automobile insurance fraud involving fraudulent actions between policyholders and repair shops, who mutually rely on each other to obtain benefits (Aslam et al., 2022; Nian et al., 2016; Subudhi and Panigrahi, 2020); as a result of the issues they face, insurance companies have developed robust models using ML.
As regards internal fraud, caused by an individual within the company, 46% of studies have analyzed this type, with financial statement fraud, money laundering fraud, and tax fraud standing out. The studies show that the investigations are based on information reported by the US Securities and Exchange Commission (SEC) and the stock exchanges of China, Canada, Tehran, and Taiwan, among others. To a considerable extent, the information taken is from the real sector, and very few studies have obtained synthetic information based on the application of different learning models.
The following is a summary of the financial information obtained by the researchers to apply AI models and techniques:
-
a.
Stock market financial reports: Fraud in the Canadian securities industry (Lokanan and Sharma, 2022), companies listed on the Chinese stock exchanges (Achakzai and Juan, 2022; Y. Chen and Wu, 2022; Xiuguo and Shengyong, 2022), companies with shares according to the SEC (Hajek and Henriques, 2017; Papík and Papíková, 2022), companies listed on the Tehran Stock Exchange (Kootanaee et al. 2021), companies in the Taiwan Economic Journal Data Bank (TEJ) stock market (S. Chen, 2016; S. Chen et al., 2014), analysis of SEC accounting and auditing publications (Whiting et al., 2012)
-
b.
Wrong financial reporting to manipulate stock prices (Chullamonthon and Tangamchit, 2023; Khan et al., 2022; Zhao and Bai, 2022)
-
c.
Financial data of 2318 companies with the highest number of financial frauds (mechanical equipment, medical biology, media, and chemical industries; Shou et al., 2023), fraudulent financial restatements (Dutta et al., 2017)
-
d.
Data from 950 companies in the Middle East and North Africa region (Ali et al., 2023), analyzing outliers in sampling risk and inefficiency of general ledger financial auditing (Bakumenko and Elragal, 2022), fraudulent intent errors by top management of public companies (Y. J. Kim et al., 2016), reporting of general ledger journal entries from an enterprise resource planning system (Zupan et al., 2020)
-
e.
Synthetic financial dataset for fraud detection (Alwadain et al., 2023).
Studies have analyzed situations involving fraudulent financial statements. In these cases, instances of fraud have already occurred, leading to the creation of financial reports that contain statements with outliers that can be deemed fraudulent intent or errors in financial figures. This raises a reasonable doubt about whether an intent exists with regard to the reporting of unrealistic figures. Notably, once there are parties responsible for the financial information presented to stakeholders, such as organization owners, managers, administrators, accountants, or auditors, it is unlikely for it to be unintentional (an error). In this context, transparency and explainability are essential so as to ensure fairness in decisions, thus avoiding bias and discrimination based on prejudiced data (Rakowski et al., 2021).
Because of its significance, the information reported in financial statements is vital for investigations. Studies have indicated substantial amounts of data extracted from the financial reports of regulatory bodies such as stock exchanges and auditing firms. These entities use the data to establish the existence of fraud and its types through predictive models that use ML techniques. Thus, they require financial data such as dates, the third party affected, user, debit or credit amount, and type of document, among other aspects involving an accounting record. This information aids in identifying the possible impact in terms of lower profits and the perpetrator and/or perpetrators to gather sufficient evidence and file criminal proceedings for the financial damage caused.
Moreover, investigations concerning money laundering fraud and/or money laundering, the second most investigated internal fraud type, encompass the reports of natural and legal persons exposed by the Financial Action Task Force in countries such as the Kingdom of Saudi Arabia (Alsuwailem et al., 2022), transactions from April to September 2018 from Taiwan’s “T” bank and the account watch list of the National Police Agency of the Ministry of Interior (Ti et al., 2022), money laundering frauds in Middle East banks (Lokanan, 2022), transactions of financial institutions in Mexico from January 2020 (Rocha-Salazar et al., 2021), and synthetic data of simulated banking transactions (Usman et al., 2023).
Concerns regarding the entry of proceeds from money laundering into an organization have been articulated in relation to the financial damage it causes to the country. At the macroeconomic level, these activities negatively affect financial stability, distorting the prices of goods and services. Moreover, such activities disrupt markets, making it difficult to make efficient financial decisions. At the microeconomic level, legitimate businesses face unfair competition with companies using illegal money, which may lead to higher unemployment levels. Furthermore, money laundering has a social impact because it affects the security and welfare of society.
Thus, some research works (Alsuwailem et al., 2022) have indicated the need to implement ML models for promoting anti-money laundering measures. For instance, in Saudi Arabia, money from illicit drug trafficking, corruption, counterfeiting, and product piracy have entered the country. The measures to be taken are categorized according to the three stages of money laundering: placement, layering (also known as concealment), and integration. These include new legal regulations against money laundering, staff training, customer identification and validation, reporting of suspicious activities, and documentation and storage of relevant data (Bolgorian et al., 2023).
Regarding the 7.5% incidence of internal fraud, specifically categorized as tax fraud resulting from tax evasion, the studies have analyzed tax returns on income and/or profits of legal persons and/or individuals from the Serbian tax administration during 2016–2017 (Savić et al., 2022). Studies have encompassed periodic value-added tax (VAT) returns, together with the anonymous list of clients for the tax year 2014 obtained from the Belgian tax administration (Vanhoeyveld et al., 2020) and income tax and VAT taxpayers registered and provided by the State Revenue Committee of the Republic of Armenia in 2018 (Baghdasaryan et al., 2022). These studies hold great relevance for tax administrations using different strategies to minimize the impact of fraud resulting from tax evasion. Tax evasion reduces the government’s ability to collect revenue, directly affecting government finances and causing budget deficits, thereby increasing public debt.
GQ3: Which ML models were implemented to detect financial fraud in the datasets?
Given that ML is a key tool to extract meaningful information and make informed decisions, this study analyzes the most widely used ML techniques in the field of financial fraud detection. It takes as reference 86 experimental articles, excluding 18 SLR articles. In these articles, the most commonly used trends and approaches in the implementation of ML techniques in financial fraud detection were identified.
For the analysis, the pattern of frequency of use of ML models was observed. Several of them have been prominent because of their popularity and implementation in detecting financial fraud (Fig. 7). Some of the most widely used models include long-short term memory (LSTM) with 7 mentions, autoencoder with 10 mentions, XGBoost with 13 mentions, k-nearest neighbors (KNN) with 14 mentions, artificial neural network (ANN) with 17 mentions, NB with 19 mentions, SVM with 29 mentions, DT with 29 mentions, LR with 32 mentions, and RF with 34 mentions.

Illustrates the most common machine learning models in financial fraud detection. Authors’ own elaboration.
The LSTM model is a recurrent neural network used for sequence processing, especially for tasks concerning natural language processing (Chullamonthon and Tangamchit, 2023; Esenogho et al., 2022; Femila Roseline et al., 2022). Moreover, autoencoders are models used for data compression and decompression. These models are useful in dimensionality reduction applications (Misra et al., 2020; Srokosz et al., 2023). XGBoost is a library combining multiple weak DT models, offering a scalable and efficient solution in classification and regression tasks (Dalal et al., 2022; Udeze et al., 2022).
KNN and ANN are widely used models in various ML applications. KNN is based on neighbor closeness, and ANN is inspired by human brain functioning. NB is a probabilistic algorithm commonly used in text classification and data mining (Ashtiani and Raahemi, 2022; Lei et al., 2022; Shahana et al., 2023).
SVM, DT, LR, and RF, the most commonly mentioned models, are used in a wide range of classification and regression applications. These models are prominent because of their effectiveness and applicability to different scenarios, such as credit card loan fraud (external fraud) and financial statement fraud (internal fraud).
The most frequently used ML techniques are supervised learning (56.73%); unsupervised learning (18.29%), a combination of supervised and unsupervised learning (15.38%), a combination of supervised and deep learning (2.88%), and mathematical approach, supervised, and semi-supervised learning (0.96%). Figure 8 presents the ML techniques in the literature reviewed and indicates the number of times each type of technique is applied. Some articles applied several ML methods, in which the algorithms are mainly classified according to the learning method. In this case, there are four main types: supervised, semi-supervised, unsupervised, and deep learning.

Shows the different experimental approaches used in the study. Authors’ own elaboration.
Supervised learning is the most widely used technique, with 56.73% of citations in financial fraud studies. In this approach, labeled training data are used, where the expected outputs are known and a model is built that can make higher-accuracy predictions on new unlabeled data. Common examples of supervised learning techniques include the models of LR, SVM, DT, RF, KNM, NB, and ANN.
Moreover, unsupervised learning constitutes 18.27% of the mentions. The technique focuses on discovering patterns in the data without knowing data with labels and/or types for training. Some of these include DBSCAN, autoencoder, and isolation forest (IF).
The combination of supervised, unsupervised, and semi-supervised learning is used with a frequency of 1.92%. This technique and/or approach combines elements of supervised and unsupervised learning, using both labeled and unlabeled data to train the models. It is also used when labeled data are scarce or expensive to obtain; thus, the aim is to take advantage of unlabeled information to improve model performance.
Finally, supervised and deep learning represents 2.88% of the mentions. It is based on deep neural networks with multiple neurons and hidden layers to learn complex data representations. It has achieved remarkable developments in areas such as image processing, voice recognition, and machine translation.
Specific questions (SQ)
SQ1: What datasets were used by implementing ML models for financial fraud detection?
First, the data structure and fraud types may vary with the collection of datasets. The performance of fraud detection models may be affected by variations in the number of instances and attributes selected. Therefore, investigating the datasets and their characteristics is relevant, as data differ in terms of data type (number, text) and the data source from which they were obtained (synthetic and/or real), as can be observed in Fig. 9.

Depicts the datasets used in the research on financial fraud detection. Authors’ own elaboration.
Credit card fraud detection
The dataset was created by the Machine Learning group at Université Libre de Bruxelles. It encompasses anonymized credit card transactions labeled as fraudulent or genuine. The transactions were performed in September 2013 over two days by European cardholders; a record of only 492 frauds out of 284,807 transactions is highly unbalanced because the positive types (frauds) represent only 0.172% of all transactions (Machine Learning Group, 2018).
The characteristics of the set encompass numerical variables resulting from a principal component analysis (PCA) transformation. For confidentiality, the original features of the data have not been disclosed. Features V1, V2…, V28 have been the main components obtained through PCA. The only features that have not transformed with PCA include “Time,” which denotes the seconds elapsed between each transaction. “Amount” denotes the transaction amount. The “Class” feature is the response variable, taking 1 as the value in case of fraud and 0 (no fraud) otherwise.
This dataset has been used by 15 authors in their papers, who have applied different financial fraud detection techniques (Alarfaj et al., 2022; Baker et al., 2022; Fanai and Abbasimehr, 2023; Fang et al., 2019; Femila Roseline et al., 2022; Hwang and Kim, 2020; Ileberi et al., 2021, 2022; Khan et al., 2022; Misra et al., 2020; Ounacer et al., 2022).
Statlog (German credit data)
The dataset was proposed by Professor Hofmann to the UC Irvine ML repository on November 16, 1994, for facilitating credit rating (Hofmann, 1994). It mainly aims to determine whether a person presents a favorable or unfavorable credit risk (binary rating). The set is multivariate, which implies that it contains many attributes used in credit rating. These attributes include information on existing current account status, credit duration, credit history, and credit purpose and amount, among others. In total, there are 20 attributes describing several characteristics of individuals and contains 1000 instances; it has been widely used in research related to credit rating (Esenogho et al., 2022; Fanai and Abbasimehr, 2023; Lee et al., 2018; Pumsirirat and Yan, 2018; Seera et al., 2021).
Stalog (Australian credit approval)
The dataset belongs to the UC Irvine ML repository and was created by Ross Quinlan in 1997. It focuses on credit card applications within the financial field (Quinlan, 1997). It has a total of 690 instances and 14 attributes of which 6 are numeric of type integer/actual and 8 are categorical; consequently, its data characteristics are multivariate—that is, it contains multiple variables and/or attributes. Several studies have used the ensemble data (Lee et al., 2018; Pumsirirat and Yan, 2018; Seera et al., 2021; Singh et al., 2022).
China Stock Market and Accounting Research
The China Stock Market and Accounting Research (CSMAR) Database contains financial reports and violations of CSMAR. It provides information on China’s stock markets and the financial statements of listed companies; the data were collected between 1998 and 2016 from publicly funded companies (CSMAR, 2022). It includes fraudulent and non-fraudulent companies committing several types of fraud, such as showing higher profits and/or earnings, fictitious assets, false records, and other irregularities in financial reporting.
The set comprises 35,574 samples, including 337 annual fraud samples of companies in the Chinese stock market. This is selected as a data source to illustrate the financial statement information of listed companies in three studies (Achakzai and Juan, 2022; Y. Chen and Wu, 2022; Shou et al., 2023).
Synthetic financial datasets for fraud detection
It was generated by the PaySim mobile money simulator using aggregated data from a private dataset deriving from one month of financial records from a mobile money service in an African country (López-Rojas, 2017). The original records were provided by a multinational company offering mobile financial services in more than 14 countries worldwide. The dataset has been used in numerous studies (Alwadain et al., 2023; Hwang and Kim, 2020; Moreira et al., 2022).
The synthetic dataset provided is a scaled-down version, representing a quarter of the original dataset. It was made available for Kaggle. It constitutes 6,362,620 samples, with 8213 fraudulent transaction samples and 6,354,407 non-fraudulent transactions. It includes several attributes related to mobile money transactions: transaction type (cash-in, cash-out, debit, payment, and transfer); transaction amount in local currency; customer information (customer conducting the transaction and transaction recipient); initial balances before and after the transaction; and fraudulent behavior indicators (isFraud and isFlaggedFraud). These attributes indicate a binary classification.
Default of credit card clients
It was created by I-Cheng Yeh and introduced on January 25, 2016, and is available in the UC Irvine ML repository (Yeh, 2016). The dataset, which is used for classification tasks, focuses on the case of defaulted payments of credit card customers in Taiwan in the business area. Moreover, it is a multivariate dataset with 30,000 instances and 24 attributes. They include attributes such as the amount of credit granted, payment history, and statement records spanning April through September 2005. This data source is selected in studies such as those by Esenogho et al. (2022), Pumsirirat and Yan (2018), and Seera et al. (2021).
Synthetic data from a financial payment system
Edgar Lopez Rojas created the dataset in 2017. The synthetic data were generated in the BankSim payment simulator. It is based on a sample of transactional data provided by a bank in Spain (López-Rojas, 2017). It includes the following characteristics: step, customer ID, age, gender, zip code, merchant ID, zip code of merchant, category of purchase, amount of purchase, and fraud status. It comprises 594,643 transactions, of which ~1.2% (7200) were labeled as fraud and the rest (587,443) were labeled as genuine, and it was processed as a binary classification problem. The dataset has been used in several investigations (Esenogho et al., 2022; Pumsirirat and Yan, 2018; Seera et al., 2021).
COMPUSTAT
This dataset is a financial and economic information and research database (Compustat, 2022). It contains characteristics related to various aspects of companies, such as asset quality, revenues earned, administrative and sales expenses, and sales growth, among others. COMPUSTAT collects and stores detailed information on listed companies in the United States and Canada. The set includes information on 61 characteristics and consists of 228 companies, of which half showed fraud in their information while the other half did not present fraud (binary classification), and it is used in studies (Dutta et al., 2017; Whiting et al., 2012).
Insurance Company Benchmark (COIL 2000)
This dataset is used in the CoIL 2000 challenge, available at the UC Irvine Machine Learning Repository, created by Peter Van Der Putten. It consists of 9822 instances and 86 attributes containing information about customers of an insurance company and includes data on product use and sociodemographic data (Putten, 2000). It is characterized as multivariate and is used to perform regression/classification tasks by studies using the dataset (Huang et al., 2018; Sathya and Balakumar, 2022).
Bitcoin network transactional metadata
This dataset contains Bitcoin transaction metadata from 2011 to 2013. It was created by Omer Shafiq (Kaggle handle: OmerShafiq) and introduced to the Kaggle online community in 2019. The set comprises 11 attributes and 30,000 instances related to Bitcoin transactions, bitcoin flows, connections between transactions, average ratings, and malicious transactions (Omershafiq, 2019). It is efficient for investigating and analyzing anomalies and fraud detection in Bitcoin transactions (Ashfaq et al., 2022).
SQ2: What were the metrics used to assess the performance of ML models to detect financial fraud?
Based on previous studies (Nicholls et al., 2021; Shahana et al., 2023), the performance of the metrics used in ML models is the last step in determining whether the results align with the problem at hand. The metrics demonstrate the ability to do a specific task, such as classification, regression, or clustering quality, as they allow comparing the performance of models.
Many evaluation metrics have been used in previous studies, such as precision, sensitivity, recall, accuracy, and area under the curve. These metrics can be calculated using the confusion matrix. Figure 10 compares the target and true values with the predicted ones based on the study by Torrano et al. (2018).
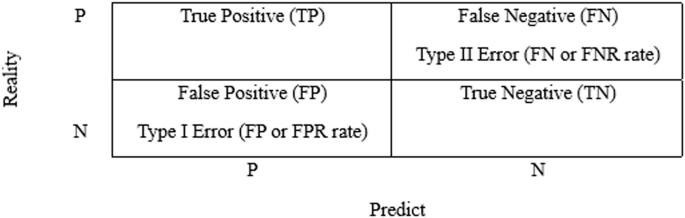
Presents the confusion matrix generated during the evaluation of the financial fraud detection models. Authors’ own elaboration.
According to previous studies (Shahana et al., 2023; Zhao and Bai, 2022), true positive (TP) projects a positive value (fraud) that matches the true value; true negative (TN) accurately predicts a negative outcome (no fraud); false positive (FP) denotes the predicted positive whose true value is negative (no fraud); and false negative (FN) represents the predicted negative whose true value is positive (fraud). FP and FN represent the misclassification cost, also known as classification model prediction error.
The metrics used to evaluate the effectiveness of supervised ML techniques are as follows. The accuracy metric is the most commonly used (Ramírez-Alpízar et al., 2020). It is defined as the total number or proportion of correct predictions/samples over the total number of records analyzed. Further, it is a method of evaluating the performance of a binary classification model distinguishing between true and false. In Eq. (1), it calculates the accuracy metric.
$${{{Accuracy}}}=\,\frac{{{{TP}}}+{{{TN}}}}{{{{TP}}}+{{{TN}}}+{{{FP}}}+{{{FN}}}}$$
(1)
The sensitivity metric known as recall (TP or TPR rate) is the ratio of successfully identified fraudulent predictions to the total number of fraudulent samples. Equation (2) calculates the sensitivity metric.
$${{{Sensitivity}}}=\,\frac{{{{TP}}}}{P}$$
(2)
The specificity metric (TN rate or TNR) is the percentage of non-fraudulent samples properly designated as non-fraudulent. It is represented in Eq. (3).
$${{{Specificity}}}=\,\frac{{{{TN}}}}{N}$$
(3)
Accuracy is the ratio of correctly classified fraudulent predictions to the total number of fraudulent predictions. Equation (4) calculates the precision metric.
$${{{Precision}}}=\,\frac{{{{TP}}}}{{{{TP}}}+{{{FP}}}}$$
(4)
F1-score is a metric that combines accuracy and recall using a weighted harmonic mean (Bakumenko and Elragal, 2022). It is presented in Eq. (5).
$$F1-{{{Score}}}=\,\frac{2* {{{Recall}}}* {{{Precision}}}}{{{{Recall}}}+{{{Precision}}}}$$
(5)
Type I error (FP or FPR rate) is the number of legitimate predictions mistakenly labeled as fraudulent as a percentage of all legitimate predictions. The metric is defined in Eq. (6).
$${{{Type}}}\,{{I}}\,{{{error}}}=\frac{{{{FP}}}}{N}=1-{{{TN}}\; {{rate}}}$$
(6)
Type II error (FN or FNR rate) is the proportion of fraudulent samples incorrectly designated as non-fraudulent. Type I and II errors make up the overall error rate. It is defined in Eq. (7).
$${{{Type}}\; {{II}}\; {{error}}}=\frac{{{{FP}}}}{{{{NP}}}}=1-{{{TP}}\; {{rate}}}$$
(7)
The area under the curve (AUC), or area under the receiver operating characteristic curve, represents a graphic of TPR versus FPR (Y. Chen and Wu, 2022). AUC values range from 0 to 1; the more accurate an ML model, the higher its AUC value. It is a metric that represents the model’s performance when differentiating between two classes.
Following the guidelines in previous studies (Amrutha et al., 2023; García-Ordás et al., 2023; Palacio, 2019), some metrics used to evaluate the effectiveness of unsupervised ML techniques will be defined.
The silhouette coefficient identifies the most appropriate number of clusters; a higher coefficient means better quality with this number of clusters. Equation (8) calculates the metric.
$$s\left(j\right)=\frac{y-x}{\max (x,y)}$$
(8)
where x denotes the average of the distances of observation j with respect to the rest of the observations of the cluster to which j belongs. Furthermore, y denotes the minimum distance to a different cluster. The silhouette score takes values between −1 and 1. Based on the study by Viera et al. (2023), 1 (correct) represents the assignment of observation j to a good cluster, zero (0) indicates that observation j is between two distinct groups, and −1 (incorrect) indicates that the assignment of j to the cluster is a bad clustering.
The rand index is the similarity measure between two clusters considering all pairs and including those assigned to the same cluster in both the predictions and the true cluster. Equation (9) calculates the index.
$${{{RI}}}=\frac{{{{TP}}}+{{{TN}}}}{{{{TP}}}+{{{FP}}}+{{{TN}}}+{{{FN}}}}* 100$$
(9)
The Davies–Bouldin metric is a score used to evaluate clustering algorithms. It is defined as the mean value of the samples, represented in Eq. (10).
$${DB}=\frac{1}{K}\mathop{\sum }\limits_{i=1}^{k}{{\max }\atop{j\ne i}}\left(\frac{{\alpha }_{i}+{\alpha }_{j}}{d\left({c}_{i},{c}_{j}\right)}\right)$$
(10)
where k denotes the number of groups \({c}_{i},{c}_{j}\), k represents the centroids of cluster i and j, respectively, with \(d\left({c}_{i},{c}_{i}\right)\) as the distance between them, while \({\alpha }_{i}\) and \({\alpha }_{j}\) corresponds to the average distance of all elements in clusters i and j and the distance to their respective \({c}_{i}\) and \({c}_{j}\) centroids (Viera et al., 2023).
The Fowlkes–Mallows index is defined as the geometric mean between precision and recall, represented in Eq. (11).
$${{{FM}}}=\sqrt{\frac{{{{TP}}}}{{{{TP}}}+{{{FP}}}}* \frac{{{{TP}}}}{{{{TP}}}+{{{FN}}}}}$$
(11)
The cophenetic correlation coefficient is a clustering method to produce a dendrogram (tree diagram). Equation (12) indicates the metric.
$${{{CPC}}}=\frac{{\sum }_{i < j}(x\left(i,j\right)-\bar{x})(t\left(i,j\right)-\bar{t})}{\sqrt{\left[{\sum }_{i < j}(x\left(i,j\right){-\bar{x}})^{2}\right]\left[{\sum }_{i < j}(t\left(i,j\right)-{\bar{t}})^{2}\right]}}$$
(12)
where \(x(i,j)=|{x}_{i}-{x}_{j}|\) represents the Euclidean distance between the ith and jth points of \(x\). While \(t(i,j)\) is the height of the node at which the two points, \({t}_{i}\) and \({t}_{j}\), of the dendrogram meet and \(\bar{x}\) and \(\bar{t}\) are the mean value of \(x(i,j)\) and \(t(i,j).\)